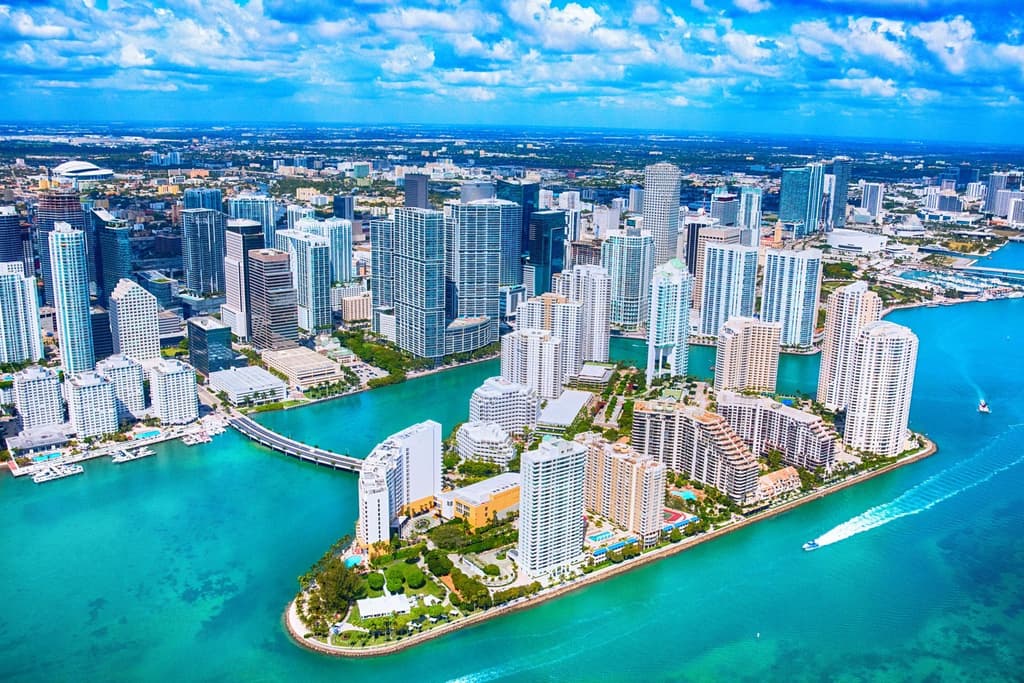
Current National Weather Service forecasts and supporting model guidance indicate a high in the lower 90s for Miami on August 25, driven by typical late-summer easterly flow, abundant moisture, and diurnal heating under partly to mostly sunny skies with only a 30-40% chance of afternoon convection. This consensus positions the 92-93°F bin as the slight market leader, reflecting some point forecasts and recent runs reaching the upper end of that range, while 90-91°F captures the broader lower-90s expectation amid variable storm timing that can briefly suppress or enhance peaks. Heat indices near 105°F underscore the humid boundary layer, consistent with August climatology where daily maxima average near 91°F, though model spread and steering patterns introduce modest uncertainty ahead of the next forecast update.
Experimental AI-generated summary referencing Polymarket data. This is not trading advice and plays no role in how this market resolves. · UpdatedHighest temperature in Miami on August 25?
Highest temperature in Miami on August 25?
92-93°F 55%
90-91°F 40%
88-89°F 4%
94-95°F 3%
$10,540 Vol.
$10,540 Vol.
81°F or below
<1%
82-83°F
<1%
84-85°F
<1%
86-87°F
1%
88-89°F
4%
90-91°F
40%
92-93°F
55%
94-95°F
3%
96-97°F
1%
98-99°F
<1%
100°F or higher
<1%
92-93°F 55%
90-91°F 40%
88-89°F 4%
94-95°F 3%
$10,540 Vol.
$10,540 Vol.
81°F or below
<1%
82-83°F
<1%
84-85°F
<1%
86-87°F
1%
88-89°F
4%
90-91°F
40%
92-93°F
55%
94-95°F
3%
96-97°F
1%
98-99°F
<1%
100°F or higher
<1%
The resolution source for this market will be information from NOAA, specifically the highest reading under the "Temp" column for all times on this day, available here: https://www.weather.gov/wrh/timeseries?site=kmia
This market will resolve off of the Hourly Data provided using the "Show Hourly Data" button.
To toggle between Fahrenheit and Celsius, click the "Switch to US Units w/ kts" button until the relevant table displays °F.
This market can not resolve until the first data point for the following date has been published on the resolution source.
The resolution source for this market measures temperatures to whole degrees Fahrenheit (eg, 21°F). Thus, this is the level of precision that will be used when resolving the market.
Revisions to temperatures recorded within this market's timeframe will be considered until the first datapoint for the following date has been published, after which any alterations will not be considered.
Market Opened: Aug 23, 2026, 8:56 PM ET
Resolution Source
https://www.weather.gov/wrh/timeseries?site=kmiaResolver
0x69c47De9D...The resolution source for this market will be information from NOAA, specifically the highest reading under the "Temp" column for all times on this day, available here: https://www.weather.gov/wrh/timeseries?site=kmia
This market will resolve off of the Hourly Data provided using the "Show Hourly Data" button.
To toggle between Fahrenheit and Celsius, click the "Switch to US Units w/ kts" button until the relevant table displays °F.
This market can not resolve until the first data point for the following date has been published on the resolution source.
The resolution source for this market measures temperatures to whole degrees Fahrenheit (eg, 21°F). Thus, this is the level of precision that will be used when resolving the market.
Revisions to temperatures recorded within this market's timeframe will be considered until the first datapoint for the following date has been published, after which any alterations will not be considered.
Resolution Source
https://www.weather.gov/wrh/timeseries?site=kmiaResolver
0x69c47De9D...Current National Weather Service forecasts and supporting model guidance indicate a high in the lower 90s for Miami on August 25, driven by typical late-summer easterly flow, abundant moisture, and diurnal heating under partly to mostly sunny skies with only a 30-40% chance of afternoon convection. This consensus positions the 92-93°F bin as the slight market leader, reflecting some point forecasts and recent runs reaching the upper end of that range, while 90-91°F captures the broader lower-90s expectation amid variable storm timing that can briefly suppress or enhance peaks. Heat indices near 105°F underscore the humid boundary layer, consistent with August climatology where daily maxima average near 91°F, though model spread and steering patterns introduce modest uncertainty ahead of the next forecast update.
Experimental AI-generated summary referencing Polymarket data. This is not trading advice and plays no role in how this market resolves. · Updated
Beware of external links.
Beware of external links.
Frequently Asked Questions